Standard Deviation Calculator
Paste your numbers to get the sample (s) and population (σ) standard deviation — with the full deviation table as the working.
Separate values with commas, spaces or line breaks — a column pasted from Excel or Google Sheets works as-is. Anything that is not a number is ignored, never counted as zero.
The toggle changes only the standard deviation and variance — the mean, median and mode are the same either way.
What is standard deviation?
Standard deviation measures how spread out the values in a data set are — the typical distance between each value and the mean. Two classes can share a mean of 80 while one scores tightly between 76 and 84 (small standard deviation) and the other swings from 40 to 100 (large standard deviation). The mean alone cannot tell those classes apart; the standard deviation can. It is the most widely reported spread statistic in science, finance, manufacturing and education, and it is always expressed in the same units as the data — points, dollars, degrees.
Standard deviation formula (sample and population)
Population: σ = √( Σ(x − μ)² ÷ N )
Find the mean, subtract it from each value, square the differences, average them (by n − 1 for a sample, N for a population), then take the square root. The quantity inside the root is the variance.
How to calculate standard deviation step by step
Worked example — the test scores 78, 85, 92, 85, 90, 76, 85, 94:
Step 1 — Mean. 685 ÷ 8 = 85.625.
Step 2 — Deviations, squared. Subtract 85.625 from each score and square: the eight squared deviations are 58.14, 0.39, 40.64, 0.39, 19.14, 92.64, 0.39 and 70.14 (rounded).
Step 3 — Add them. The squared deviations sum to 281.875.
Step 4 — Divide. Sample: 281.875 ÷ 7 = 40.27 (the sample variance). Population: 281.875 ÷ 8 = 35.23.
Step 5 — Square root. Sample SD s = √40.27 ≈ 6.35. Population SD σ = √35.23 ≈ 5.94. The deviation table above shows every row of this working for your own numbers.
Sample vs population — which one do I need?
Ask one question: is my data the whole group I care about, or a sample of it? If you measured every member — all 30 students in the class, all 12 months of the year — you have a population: divide by N. If your data stands in for a bigger group — 30 students sampled from a school, 100 voters sampled from a country — divide by n − 1 and use the sample version. The toggle at the top of this calculator switches the headline result; both are always shown in the grid. The full explanation, with the symbols x̄ and μ, is in our sample mean vs population mean guide.
What does the standard deviation tell you?
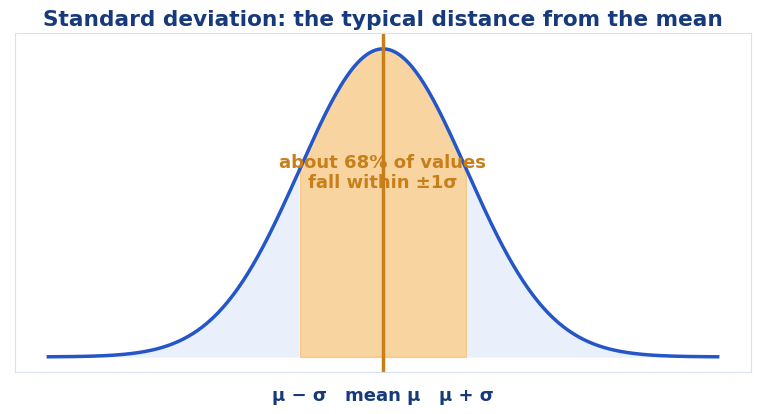
It converts "spread" into a number you can compare. For roughly bell-shaped data, about 68% of values fall within one standard deviation of the mean and about 95% within two — so a score of 98 in our example class (mean 85.6, s ≈ 6.35) sits about two standard deviations up: unusual, but not impossible. Once you have the mean and standard deviation, a z-score calculator can standardize any single value — showing exactly where it stands relative to the group — which is the natural next step after this page. Small print: standard deviation is pulled by outliers just as the mean is; for heavily skewed data, pair it with the median and IQR from the five number summary calculator.
Frequently asked questions
What is the difference between sample and population standard deviation?
Population divides by N (you have every value); sample divides by n − 1 (your data is a sample of a bigger group). The sample version is slightly larger to correct for sampling error.
What does a standard deviation of zero mean?
Every value is identical — there is no spread at all.
Is a higher standard deviation always worse?
No — it simply means more spread. Whether that is good or bad depends on what you are measuring.
What is the standard deviation of 78, 85, 92, 85, 90, 76, 85, 94?
The mean is 85.625 and the squared deviations add to 281.875. As a sample: s = √(281.875 ÷ 7) ≈ 6.35. As a population: σ = √(281.875 ÷ 8) ≈ 5.94.
Why does the sample version divide by n − 1?
Because a sample's values cluster a little closer to the sample mean than to the true population mean, dividing by n would slightly underestimate the spread. Dividing by n − 1 (Bessel's correction) inflates the result just enough to make it unbiased on average.