Mean Absolute Deviation Calculator
Paste your numbers to get the mean absolute deviation — the average distance from the mean — with the deviation table shown.
Separate values with commas, spaces or line breaks — a column pasted from Excel or Google Sheets works as-is. Anything that is not a number is ignored, never counted as zero.
What is mean absolute deviation?
The mean absolute deviation (MAD) is the average distance between each value and the mean. If the mean is the centre of a data set, the MAD says how far away the values typically sit from that centre — in the original units, with no squaring and no square roots. It is a staple of school statistics curricula precisely because every step can be done and checked by hand, and because the answer reads plainly: "on average, values are about 1.2 away from the mean."
MAD formula
Find the mean, take each value's distance from it (ignoring minus signs), and average those distances.
How to calculate MAD step by step
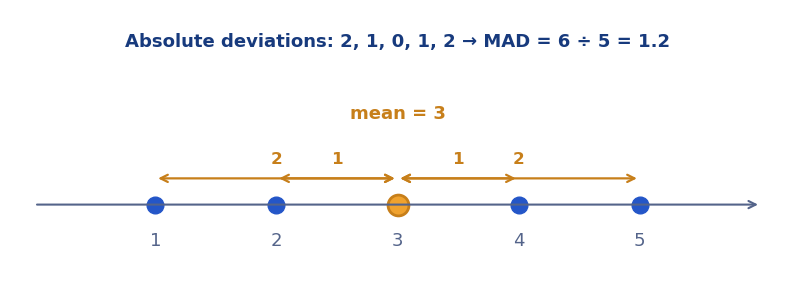
Worked example — the set 1, 2, 3, 4, 5:
Step 1 — Mean. 15 ÷ 5 = 3.
Step 2 — Absolute deviations. |1 − 3| = 2, |2 − 3| = 1, |3 − 3| = 0, |4 − 3| = 1, |5 − 3| = 2.
Step 3 — Add them. 2 + 1 + 0 + 1 + 2 = 6.
Step 4 — Divide by the count. 6 ÷ 5 = 1.2. The MAD is 1.2: the values sit, on average, 1.2 units from their mean.
MAD vs standard deviation
Both statistics answer "how spread out?" around the same centre. The difference is how distance is measured: MAD averages the distances as they are, while the standard deviation squares each distance first (and roots the result), which makes big deviations count disproportionately. For the set 1, 2, 3, 4, 5 the MAD is 1.2 and the sample standard deviation is ≈ 1.58 — same data, same story, different emphasis. Statisticians reach for the standard deviation because squared deviations have convenient mathematical properties; teachers reach for MAD because students can see every step. The MAD guide compares them on several sets.
What MAD tells you
A small MAD relative to the mean means a consistent data set — a machine filling bottles to within a whisker, a class whose scores cluster. A large MAD means the "average" is a loose summary and individual values wander far from it. Because MAD is in the original units and resists exaggeration better than variance, it is a good first spread statistic to quote next to any mean — and a good check on whether the mean deserves to be quoted at all.
MAD for consistency checks
Because MAD is in plain units, it is the spread statistic people reach for when judging consistency. A bottling line fills five bottles to 498, 502, 500, 501 and 499 ml. The mean fill is exactly 500 ml — but is the line consistent? The absolute deviations are 2, 2, 0, 1 and 1, so the MAD is 6 ÷ 5 = 1.2 ml: a typical bottle lands about a millilitre from target. A rival line with the same mean but a MAD of 6 ml is the sloppier machine, whatever the brochure's average claims. Coaches use the same logic on lap times, teachers on quiz scores, and analysts on forecast errors (where MAD's sibling, mean absolute error, is a standard scoreboard). Paste the five fills above and the deviation table reproduces this working.
Frequently asked questions
What is the mean absolute deviation of 1, 2, 3, 4, 5?
The mean is 3; the absolute deviations are 2, 1, 0, 1, 2; their mean is 6 ÷ 5 = 1.2.
How is MAD different from standard deviation?
Both measure spread around the mean. MAD averages the absolute differences; standard deviation squares them first, which penalizes large deviations more.
Is MAD calculated from the mean or the median?
By the standard classroom definition, from the mean — 'mean absolute deviation' is the mean of the absolute deviations from the mean. (A median-based version exists in robust statistics and is also abbreviated MAD; this calculator uses the mean version.)
What does a MAD of 0 mean?
Every value equals the mean — the data set has no spread at all.
Why do some courses teach MAD instead of standard deviation?
Because every step is visible arithmetic — no squaring or square roots — so the idea of 'typical distance from the mean' lands before the machinery. MAD is the standard deviation's concept with training wheels, in the best sense.