Mean Median Mode Calculator
One paste returns the mean, median, mode and range together — each with its own step-by-step working.
Separate values with commas, spaces or line breaks — a column pasted from Excel or Google Sheets works as-is. Anything that is not a number is ignored, never counted as zero.
Mean, median and mode in one pass
Most real questions need all three measures of central tendency at once — a teacher checking a class, an analyst sanity-checking a column, a student whose worksheet asks for "the averages" plural. This calculator takes one paste and returns the mean, median and mode together, plus the range, with the working for each shown side by side: the sum-and-divide for the mean, the sorted list with the middle marked for the median, and a frequency tally for the mode.
How each one is calculated
- Mean — add all the values and divide by the count: x̄ = Σx ÷ n. Uses every value; pulled by outliers.
- Median — sort the values and take the middle one (or the average of the middle pair for an even count). Uses position only; ignores outliers.
- Mode — count how often each value appears and take the most frequent. Uses frequency only; the only average that works for categories.
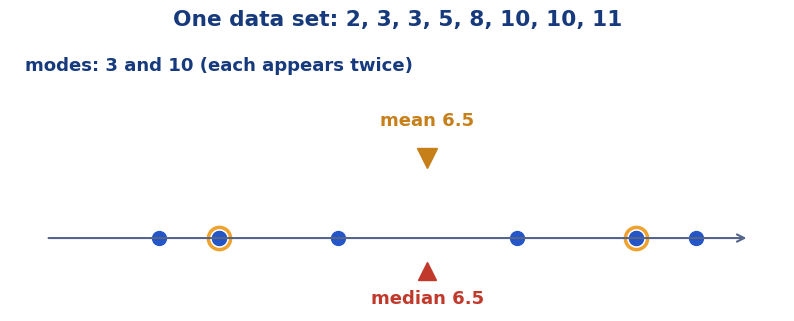
Worked example
Take the set 2, 3, 3, 5, 8, 10, 10, 11. The sum is 52 and the count is 8, so the mean is 52 ÷ 8 = 6.5. Sorted (it already is), the middle pair is 5 and 8, so the median is (5 + 8) ÷ 2 = 6.5. The tally shows 3 appearing twice and 10 appearing twice, everything else once — so the set is bimodal with modes 3 and 10. The range is 11 − 2 = 9. A set where the mean and median agree exactly while the modes sit out at the edges — a neat reminder that "the average" is three different ideas wearing one name.
Mean vs median vs mode — the differences that matter
| Measure | Question it answers | Weakness |
|---|---|---|
| Mean | If the total were shared equally, what would each get? | Dragged by extreme values |
| Median | What is the middle value? | Ignores how big the extremes are |
| Mode | What shows up most often? | May not exist, or may be several values |
The deep comparison — same data worked three ways, skewed data, and which average the news quotes — is in our mean, median and mode compared guide.
Which one should you use?
Mean when the data is fairly even and every value counts — test scores, temperatures, daily sales. Median when a few extreme values would distort the picture — salaries, house prices, delivery times. Mode when the question is about the most common case — sizes, grades, categories. And when the three disagree sharply, that disagreement is the story: say so, and quote the median as the typical value with the mean alongside. For the mean alone with the full descriptive grid (standard deviation and variance included), use the mean calculator.
A quick decision drill
Three questions, three different winners. "What score did the typical student get?" — the median, unless the marks are tightly bunched, in which case all three agree anyway. "If we pool everyone's overtime and share it equally, what does each person get?" — the mean, by definition. "Which shirt size should the shop stock most of?" — the mode; the average customer (mean size 9.4) does not exist and cannot buy anything. Naming the question first is the whole skill — the calculator above then answers all three versions of it from one paste, so you can check that the measure you chose is telling the story you think it is.
Frequently asked questions
What are the mean, median and mode of 2, 3, 3, 5, 8, 10, 10, 11?
Mean 6.5 (52 ÷ 8), median 6.5 (average of 5 and 8), modes 3 and 10 (each appears twice), range 9.
Can the mean and median be equal?
Yes — in a roughly symmetric set they often land on the same value, as in the example above.
Why calculate all three?
Together they describe a set better than any one alone: the mean uses every value, the median resists outliers, and the mode shows the most common result.
Which one should I use for my homework or report?
Use the one the question asks for. If you are choosing: mean for even, measurement-like data; median for skewed data such as incomes; mode for 'most common' questions and categories.
What if the three answers are all different?
That is normal for skewed or clustered data — it tells you the set has no single 'typical' value. Report the median as the headline and mention the mean and mode alongside.