Midrange Calculator
Paste your numbers to find the midpoint between the smallest and largest values, with the working shown.
Separate values with commas, spaces or line breaks — a column pasted from Excel or Google Sheets works as-is. Anything that is not a number is ignored, never counted as zero.
What is the midrange?
The midrange is the midpoint of a data set: the value exactly halfway between the smallest and largest values. It is the simplest possible "centre" — two numbers in, one addition, one division out. It appears in introductory statistics courses, in weather reporting ("the midrange of today's temperatures") and as a quick estimate when only the extremes of a data set are known.
Midrange formula
Add the two extreme values and halve the total.
How to calculate the midrange
Worked example — the set 48, 52, 55, 61, 90:
Step 1 — Find the extremes. Smallest = 48, largest = 90.
Step 2 — Add them. 48 + 90 = 138.
Step 3 — Divide by 2. 138 ÷ 2 = 69. The midrange is 69. (The range of the same set is 90 − 48 = 42 — the range calculator gives both measures from one paste.)
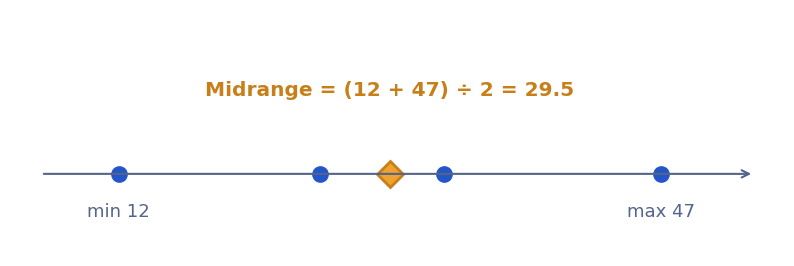
Midrange vs mean vs median
For the example set the three centres disagree: midrange 69, mean 61.2, median 55. The midrange is the most extreme-sensitive of the three because it is built from exactly the two values an outlier is most likely to corrupt. The median, sitting in the middle of the sorted data, ignores the size of the 90 entirely; the mean feels it but dilutes it across five values. The midrange hands it half the vote.
When the midrange misleads (outliers)
Change that 90 to 900 — a typo, a faulty sensor, one freak reading — and the midrange rockets to 474 while the median stays at 55 and the mean rises only to 223.2. That fragility is why the midrange is a teaching tool and a rough estimate rather than a reported statistic: use it when the extremes are trustworthy and you need a centre in seconds, then confirm with the median or the mean before quoting it anywhere it matters.
The midrange in weather and quality control
The midrange survives in two practical niches. In weather reporting, the day's midrange temperature — (high + low) ÷ 2 — is a one-number summary of the day that needs no hourly data: a high of 31 and a low of 17 give a midrange of 24, the day's thermal midpoint. In quality control, some control-chart methods plot the midrange of small samples because it can be computed on the spot from the two extreme readings of a batch. In both niches the same caveat applies: the midrange trusts the extremes completely. A single misread thermometer or one damaged item redefines it — which is why it is a starting estimate, to be confirmed against the mean or median when the number starts to matter.
Frequently asked questions
What is the midrange of 48, 52, 55, 61, 90?
(48 + 90) ÷ 2 = 69 — halfway between the smallest and largest values.
How is the midrange different from the mean?
The midrange uses only the two extreme values; the mean uses every value. One outlier can drag the midrange a long way.
Is the midrange the same as the median?
No. The median is the middle value of the sorted data; the midrange is the midpoint between the two extremes. They agree only in perfectly symmetric sets.
When is the midrange used?
As a quick centre estimate when only the extremes are known, and in some quality-control charts. For most reporting, the mean or median — which use more of the data — are better choices.