What Is an Outlier?
The definition, the 1.5×IQR fence rule worked in full, and the judgment calls — error, different group, or the most interesting value in the set.
Outlier definition
An outlier is a value that lies far away from the other values in a data set — far enough that it looks like it might not belong to the same story. A class of test scores between 70 and 95 with one score of 12; a week of commutes around 30 minutes with one of 3 hours; five salaries near $35,000 and one at $240,000. "Far away" needs a ruler, though, and statistics uses one: the 1.5×IQR rule, which the five number summary calculator applies automatically.
The 1.5 × IQR rule
Values outside the fences are flagged as outliers. IQR = Q3 − Q1, the width of the middle half of the data.
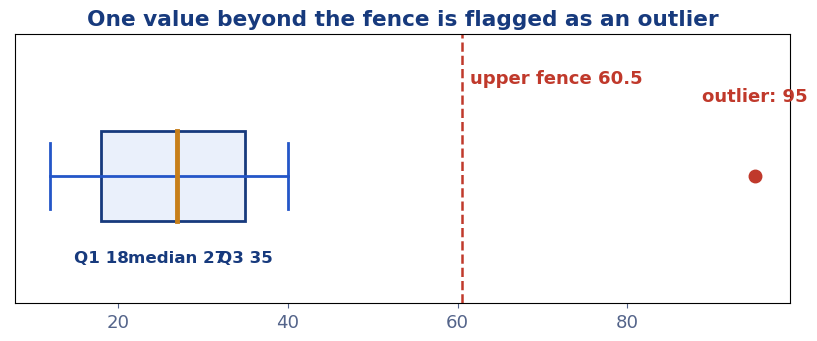
Worked fence calculation
Take the set 12, 15, 18, 22, 25, 29, 31, 35, 40. Its quartiles are Q1 = 16.5 and Q3 = 33, so the IQR is 16.5. The fences sit at 16.5 − (1.5 × 16.5) = −8.25 and 33 + (1.5 × 16.5) = 57.75. Every value lies comfortably between the fences — no outliers, despite the set spanning 12 to 40. Width alone does not make an outlier; distance beyond the middle half, scaled by that half's own width, does. Now add a value of 95 to the same set: it lands far beyond the upper fence and is flagged instantly — the box plot above shows exactly that picture.
Outliers vs mistakes — check before you delete
An outlier flag is a question, not a verdict. Work through three possibilities:
- It is an error. A mistyped 900 for 90, a sensor glitch, a unit mix-up (grams vs kilograms). Fix or remove it — and note that you did.
- It is genuine but from a different group. The owner's salary among employees; an adult's height in a children's data set. Consider analysing it separately rather than deleting it.
- It is genuine and belongs. The one flood year in rainfall data. Keep it — it may be the most important value in the set — and choose statistics it cannot hijack: median and IQR alongside the mean.
What outliers do to the mean
The mean uses every value at full weight, so an outlier pulls it in direct proportion to its distance and the smallness of the set. In the salary set, removing the owner drops the mean from $69,166.67 to $35,000 — one value in six was carrying half the story. The median, by contrast, moved not at all ($35,500 with or without the owner in a six/seven-value comparison, it barely shifts). This is why skewed data is reported with medians, and why any quoted mean deserves the question: "what is the biggest value in the set?" — a question the mean vs median guide explores in full. The quartiles and fences behind this guide are computed on the five number summary page's companion tool.
More guides
Frequently asked questions
What is an outlier in statistics?
A value that lies far from the rest of the data — formally, beyond the fences Q1 − 1.5 × IQR or Q3 + 1.5 × IQR in the standard rule.
Should I delete outliers?
Not silently, and not automatically. First check whether the value is an error. If it is genuine, report results with it — and, where it matters, quote the median alongside the mean so readers see both stories.
How do outliers affect the mean?
Directly and proportionally: in the salary example, one $240,000 value among six lifts the mean to $69,166.67 while the median stays at $35,500. The larger the outlier and the smaller the set, the bigger the drag.
What is the 1.5×IQR rule?
Tukey's rule: compute the interquartile range (Q3 − Q1), multiply by 1.5, and flag anything more than that distance beyond the quartiles as an outlier.