Range Calculator
Paste your numbers to get the range — plus the midrange, minimum and maximum — with the subtraction shown.
Separate values with commas, spaces or line breaks — a column pasted from Excel or Google Sheets works as-is. Anything that is not a number is ignored, never counted as zero.
What is the range in math?
The range is the simplest measure of spread: how far apart the smallest and largest values in a data set are. Where the mean, median and mode describe the centre of the data, the range describes its width — a class whose test scores run from 55 to 97 (range 42) is far more spread out than one running from 78 to 85 (range 7), even if their means are identical. It takes ten seconds to compute and is the first spread statistic most students meet.
Range formula
Find the largest value, find the smallest value, subtract.
How to find the range
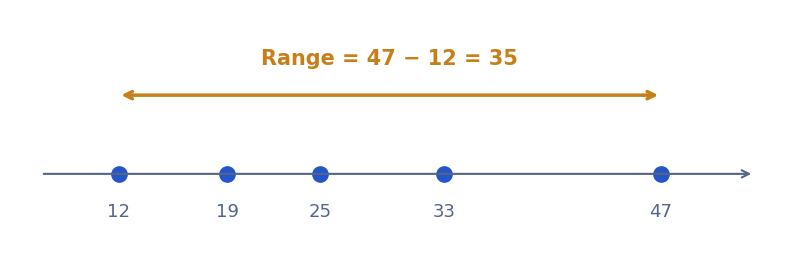
Worked example — the set 12, 19, 25, 33, 47:
Step 1 — Largest value: 47. Step 2 — Smallest value: 12. Step 3 — Subtract: 47 − 12 = 35. The range is 35. The calculator above also reports the midrange — (12 + 47) ÷ 2 = 29.5, the midpoint of the data — which has its own dedicated midrange calculator.
Range and outliers
The range has one structural weakness: it is computed from exactly two values, and they are the two most extreme ones. Add a single 240 to the salaries 32, 34, 35, 36, 38 (thousands) and the range leaps from 6 to 208 — yet nothing about the typical salary changed. Treat the range as a quick width check, not a deep description: if one value looks wildly different from the rest, read our guide on what an outlier is before quoting the range.
Range vs interquartile range
The interquartile range (IQR) measures the width of the middle half of the data — Q3 − Q1 — and ignores the extremes entirely, so outliers cannot inflate it. Report the range when you want the full span (temperatures across a day, heights in a class) and the IQR when you want the typical spread without extreme-value drama. The five number summary calculator gives the IQR, both quartiles and the outlier fences from the same paste.
The range in real data
Three everyday readings of the same tool. Temperature: a week of daily highs — 18, 21, 19, 24, 22, 20, 23 — has range 24 − 18 = 6 degrees: a settled week. The same town in a stormy month might post a range of 19. Test scores: a class scoring from 55 to 97 (range 42) is far more mixed in attainment than one scoring 74 to 88 (range 14), even if both classes average 80 — which is why teachers glance at the range before trusting the mean. Heights: a basketball squad spanning 178–203 cm (range 25) versus an office spanning 158–190 (range 32) shows the range measuring social variety as readily as athletic variety. In every case the range is in the units of the data, computed from two values, and best quoted next to a centre — the mean or median — so width and position arrive together.
Frequently asked questions
How do you find the range of a set of numbers?
Subtract the smallest value from the largest: 47 − 12 = 35 for the set 12, 19, 25, 33, 47.
Can the range be zero?
Yes — when every value is identical, max − min = 0.
What is the difference between range and midrange?
The range is the gap between the extremes (max − min); the midrange is the point halfway between them ((max + min) ÷ 2). This calculator shows both.
Why is the range so sensitive to outliers?
Because it uses only two values — the smallest and the largest. One extreme value stretches the range even if every other value is tightly packed, which is why the interquartile range is often reported alongside it.