Population Mean Calculator
Enter the complete data set — every member of the group — to find the population mean μ with the working shown.
Separate values with commas, spaces or line breaks — a column pasted from Excel or Google Sheets works as-is. Anything that is not a number is ignored, never counted as zero.
What is the population mean?
The population mean is the arithmetic mean computed over a complete group — every member, no sampling. If you have the test scores of all 30 students in a class and the class itself is what you are describing, their mean is a population mean. The number is a parameter: a fixed fact about that group, not an estimate of something bigger. Most means people meet day to day are quietly population means — a month's average temperature uses every day in the month.
Population mean formula (μ = Σx ÷ N)
Add up every value in the population (Σx) and divide by how many members there are (N — capital, because the whole population is counted).
Worked example
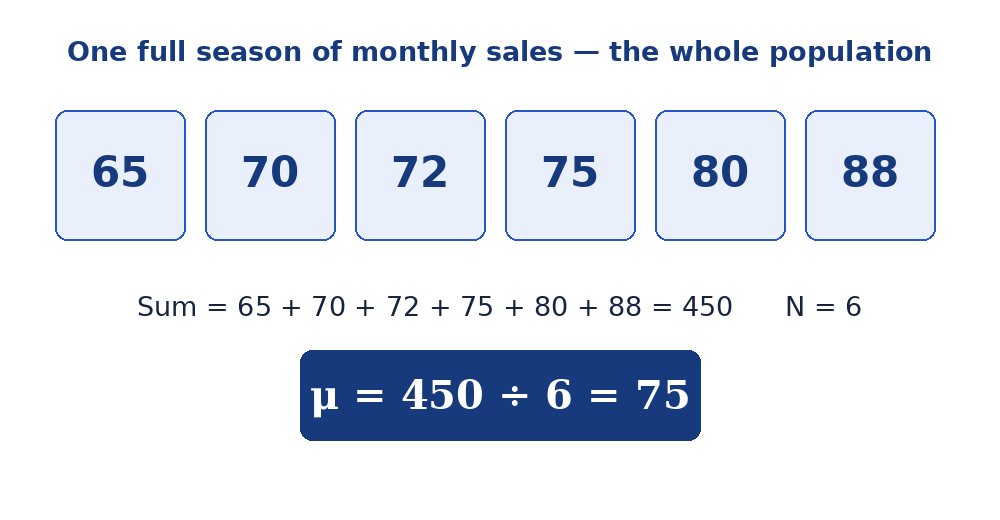
A small store records its sales index for all six months of a season: 65, 70, 72, 75, 80, 88. The season is complete — this is the whole population of months. Sum: 65 + 70 + 72 + 75 + 80 + 88 = 450. Count: N = 6. Population mean: μ = 450 ÷ 6 = 75. Enter those six values above and the steps panel reproduces this working exactly.
Population mean vs sample mean
| Population mean (μ) | Sample mean (x̄) | |
|---|---|---|
| Data covers | Every member of the group | Some members, standing in for the whole |
| Count written as | N | n |
| Arithmetic | Σx ÷ N | Σx ÷ n — identical |
| SD divisor later | N | n − 1 |
The comparison in depth — including why the sample standard deviation divides by n − 1 — is in our sample mean vs population mean guide. For the sample framing and the full results grid, the mean calculator is the same engine with the toggle.
When you actually have a population
- A whole class, team or cohort — when the group itself is the subject.
- A complete time period — every day of last month, every game of a finished season.
- A full inventory — every item in the warehouse, every transaction in the ledger.
- Not a population: the same class used to estimate the whole school, or 100 surveyed voters standing in for an electorate — those are samples, however large.
Population means in official statistics
Governments traffic in population means whenever a complete register exists: the mean age of every registered voter, the mean income across all tax returns filed, the mean household size from a full census. These are parameters — measured facts about a defined group, with no sampling error attached (measurement error is another story). The Greek letter is the tell: whenever you see μ in a textbook or paper, the author is talking about a whole population, measured or theoretical. When a census is too expensive, statisticians fall back to a sample and x̄ — and the entire machinery of inference exists to reason from that x̄ back to the μ they actually want. Your data set above is a population if it is complete for the group you are describing; the framing, not the size, decides it.
Frequently asked questions
What is the symbol for population mean?
The Greek letter μ (mu). The sample mean is written x̄.
Is the calculation different from a normal mean?
The arithmetic is identical — add and divide. 'Population' describes what your data covers: every member of the group, not a sample of it.
What is the population mean of 65, 70, 72, 75, 80, 88?
The sum is 450 and N = 6, so μ = 450 ÷ 6 = 75.
When is data a population rather than a sample?
When it includes every member of the group you are describing: all students in one class (if the class is the topic), all days in a month, all products a factory made today. If the group stands in for a bigger one, it is a sample.
Why does the population mean matter for standard deviation?
Because the divisor changes with it: population standard deviation divides by N, sample standard deviation by n − 1. Getting the framing right here keeps the SD right later.