Sample Mean vs Population Mean
What x̄ and μ actually record, when each one applies, and why the standard deviation — not the mean — is where the sample/population difference bites.
What x̄ and μ mean
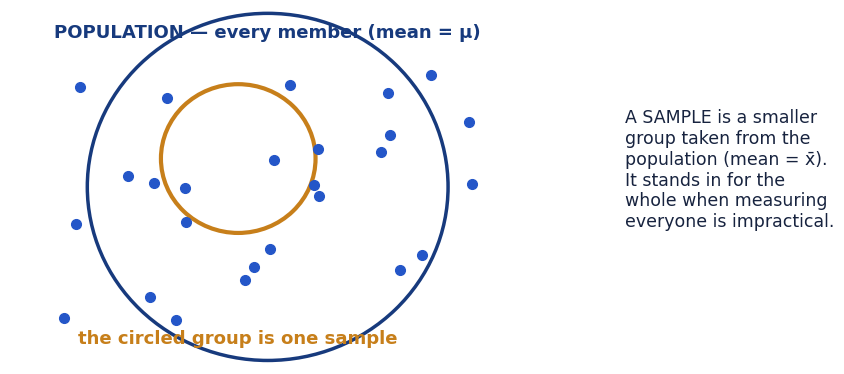
Statistics uses two symbols for the same arithmetic. x̄ ("x-bar") is the mean of a sample — some of the group. μ (the Greek letter mu) is the mean of a population — all of the group. The count gets the same treatment: n for a sample, N for a population. The formulas are literally identical — sum divided by count — because the distinction is not about the maths. It is about what the number means: μ is a fixed fact (a parameter) about a defined group; x̄ is an estimate (a statistic) of a μ you usually cannot measure directly. The population mean calculator uses the μ framing; the mean calculator is neutral and works for both.
When each is used
- Population (μ): every member measured — all 30 students in the class you teach, all 365 days of last year, every transaction in the ledger.
- Sample (x̄): a part standing in for the whole — 30 students sampled to estimate a school's performance, 1,000 voters standing in for an electorate, 50 bottles checked from a production run.
The same 30 students flip categories with the question: studying this class, they are the population; studying the school through this class, they are a sample. Decide what your data is for, and the symbol — and later, the standard deviation divisor — follows.
Why samples divide by n − 1 (for standard deviation)
The means themselves divide by the plain count either way. The famous n − 1 belongs to the sample standard deviation and variance, and the reason is subtle but intuitive: a sample's values are guaranteed to cluster around their own x̄ at least as tightly as around the unknown μ — x̄ is, by construction, the balance point of exactly those values. So Σ(x − x̄)² systematically understates the true spread. Dividing by n − 1 instead of n inflates the result just enough to make it right on average; the fudge is called Bessel's correction. With n = 30 the difference is small; with n = 5 it matters. The standard deviation calculator applies the right divisor per the toggle you choose.
How the two connect to standard deviation
| Sample | Population | |
|---|---|---|
| Mean symbol | x̄ | μ |
| Count symbol | n | N |
| Mean formula | Σx ÷ n | Σx ÷ N |
| Variance | s² = Σ(x − x̄)² ÷ (n − 1) | σ² = Σ(x − μ)² ÷ N |
| Standard deviation | s | σ |
When a sample mean itself is standardized — asking how unusual x̄ is as an estimate — the calculation leads to the z-score formula on our sister site, where the sample mean is compared against μ using the standard error. That is the boundary between descriptive statistics (this site) and standardization (theirs).
More guides
Frequently asked questions
What do x̄ and μ mean?
x̄ (x-bar) is the mean of a sample; μ (mu) is the mean of a population. The calculation — sum ÷ count — is identical; the symbols record what the data covers.
Why does sample standard deviation divide by n − 1?
A sample's values sit a little closer to the sample mean than to the true population mean, so dividing by n would understate the spread. Dividing by n − 1 (Bessel's correction) corrects that bias on average.
Is 100 people a sample or a population?
It depends on the question. All 100 employees of a company, studied as that company: a population. 100 voters standing in for a country: a sample — the size does not decide it, the role does.
Which mean should I calculate first for a z-score?
A z-score standardizes a value against a population's μ and σ where they are known, or against a sample's x̄ and s as estimates. Our sister site's z-score calculator takes it from there.