Geometric Mean Calculator
The right average for growth rates and returns — paste your numbers, or tick the box to enter growth percentages directly.
Separate values with commas, spaces or line breaks — a column pasted from Excel or Google Sheets works as-is. Anything that is not a number is ignored, never counted as zero.
What is the geometric mean?
The geometric mean is the average built for multiplication. Where the arithmetic mean adds values and divides, the geometric mean multiplies the values and takes the nth root. That makes it the correct average whenever the numbers compound: investment returns, growth rates, population growth, ratios and index numbers. If a portfolio rises 10% one year and 20% the next, it did not grow "15% a year" in any sense that reproduces the result — the geometric mean gives the single steady rate that lands in exactly the same place.
Geometric mean formula
Multiply all n values together, then take the nth root of the product.
In percentage mode — tick the box above — the calculator first converts each growth rate to a factor (10% → 1.10), multiplies the factors, takes the root, and converts back to a percentage.
How to calculate it
Worked example — returns of +10% and +20% over two years:
Step 1 — Convert to factors. +10% → 1.10, +20% → 1.20.
Step 2 — Multiply. 1.10 × 1.20 = 1.32 — $100 became $132.
Step 3 — Take the nth root and convert back. √1.32 ≈ 1.1489, so the geometric mean is ≈ 14.89% per year. Check: $100 growing at a steady 14.89% for two years gives $100 × 1.1489² = $132. The arithmetic mean of 15% would give $132.25 — close, but wrong, and the error grows with volatility and time.
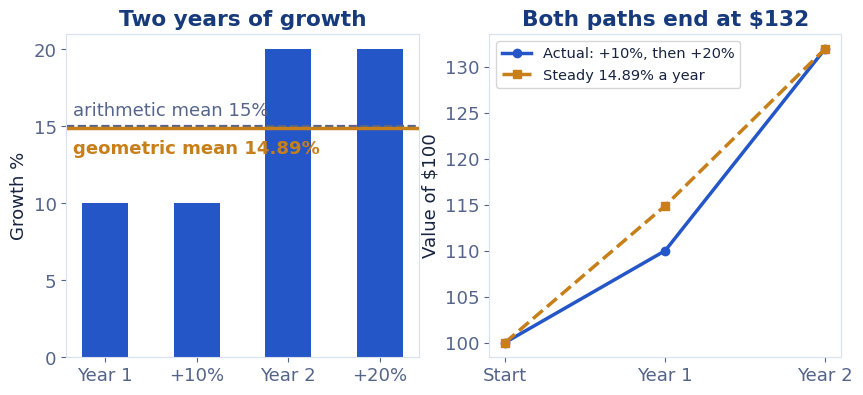
Geometric vs arithmetic mean
The two means answer different questions. The arithmetic mean asks "what equal addition reproduces the total?"; the geometric mean asks "what equal multiplier reproduces the result?" For additive data (scores, temperatures) the first is right. For multiplicative data (returns, growth, ratios) only the second is. A stark case: a fund that gains 100% then loses 50% has an arithmetic mean return of +25% — yet the money is exactly back where it started, and the geometric mean of 0% says so. Our arithmetic vs geometric mean guide compares the two on the same data in full.
When to use it (returns, growth, ratios)
- Investments: the average annual return (CAGR) is a geometric mean.
- Growth: average population, revenue or user growth over several periods.
- Ratios and rates that chain: price relatives, index construction, average speed-up factors in benchmarking.
- Not for: additive quantities, or any set containing zero or negative values — use the arithmetic mean there instead.
Reading the result: it is a CAGR
When the values are yearly growth rates, the geometric mean has a famous name: the compound annual growth rate (CAGR). The worked example above is one: $100 becoming $132 over two years is a CAGR of 14.89% — the single steady rate that connects the start and end values. Fund managers quote CAGR because it is the only "average return" that actually compounds to the truth; the arithmetic mean of yearly returns will always flatter a volatile fund. The same reading applies to revenue growth, user growth and population growth over any number of periods: enter the period rates in percentage mode and the answer is the constant rate your data is equivalent to.
Frequently asked questions
When should I use the geometric mean instead of the arithmetic mean?
When values multiply rather than add — investment returns, growth rates, ratios. It gives the constant per-period rate that produces the same overall result.
Can the geometric mean handle negative numbers?
Not meaningfully — a single negative or zero value breaks the product. For growth rates, enter them as factors (e.g. −10% as 0.90) or use the percentage mode here.
What is the geometric mean of +10% and +20% growth?
Convert to factors: 1.10 × 1.20 = 1.32, and √1.32 ≈ 1.1489 — a geometric mean of about 14.89% per period, slightly less than the misleading 15% arithmetic mean.
Why is the geometric mean always lower?
For any set of positive numbers that are not all equal, the geometric mean is below the arithmetic mean (and the harmonic mean is below both). The gap grows as the values spread out — which is exactly the volatility the arithmetic mean hides.