Mean Calculator
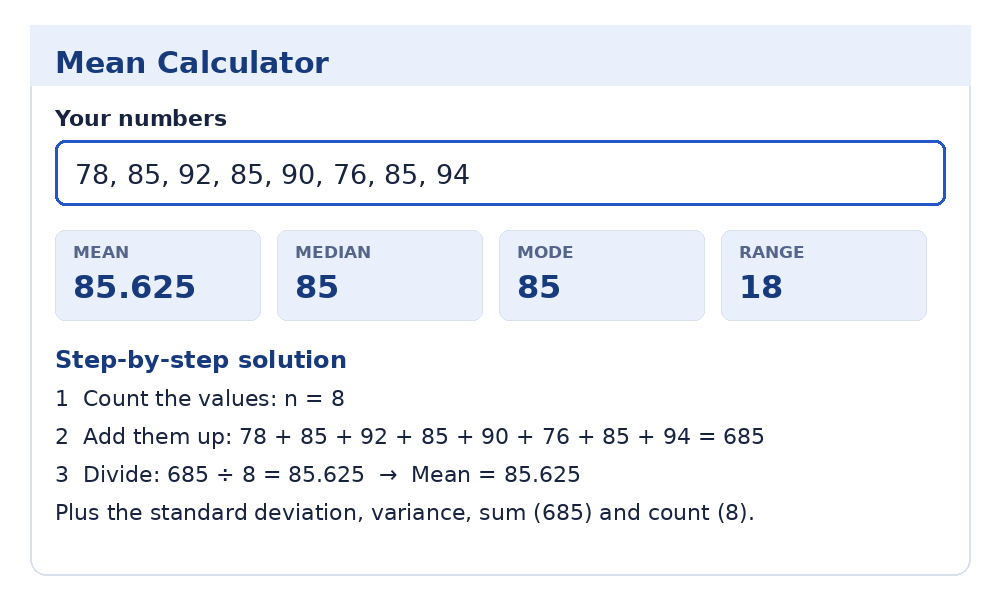
Paste any list of numbers and get the mean, median, mode and range — with every step of the working shown, so you can check it, copy it, or learn from it. Free, no signup.
Separate values with commas, spaces or line breaks — a column pasted from Excel or Google Sheets works as-is. Anything that is not a number is ignored, never counted as zero.
The toggle changes only the standard deviation and variance — the mean, median and mode are the same either way.
Results update as you type. Your numbers are calculated in your browser and never sent anywhere — no signup, no tracking of your data.
What is the mean?
The mean is the average of a data set: add up all the data values and divide by how many values there are. It is one of the three measures of central tendency — the mean, median and mode — the standard ways of describing the "typical" value in a set of numbers. Of the three, the mean is the one that uses every value in the set, which makes it both the most informative and the most easily pulled around by extreme values.
Add up all the values (Σx) and divide by the count (n). That is the whole formula — everything else on this page is detail about doing it carefully.
The mean in plain English
Think of the mean as sharing a total out equally. Eight students score 78, 85, 92, 85, 90, 76, 85 and 94 on a test — 685 points between them. If those points were shared equally, each student would get 685 ÷ 8 = 85.625. Nobody actually scored 85.625, and that is normal: the mean does not have to be one of the values, or even a whole number. It is the balance point of the data — plot the data points on a number line and the mean is where the line would balance.
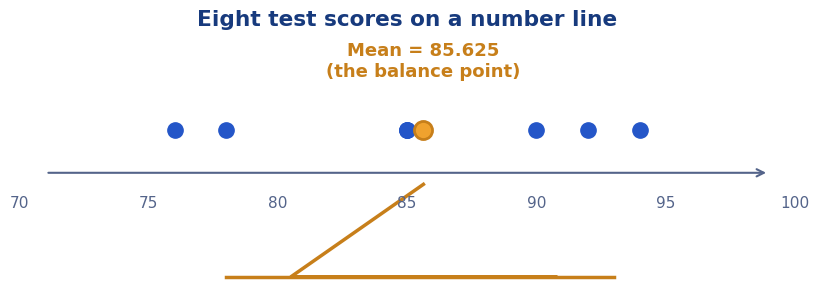
Statisticians write the mean of a sample as x̄ (pronounced "x-bar"). When the data covers an entire population rather than a sample, the same calculation is written μ (the Greek letter mu). The arithmetic is identical; only the symbol changes. This calculator finds the number either way, and the Sample/Population toggle matters only for the standard deviation and variance shown alongside.
The formula, piece by piece
- Σx — the sum of all values. Σ is the Greek capital sigma, the math symbol for "add everything up." For the test scores: 78 + 85 + 92 + 85 + 90 + 76 + 85 + 94 = 685.
- n — the count. How many values are in the set. Here, n = 8.
- x̄ — the mean. 685 ÷ 8 = 85.625. Every value contributed to this number — change any single score and the mean moves.
How to calculate the mean — step by step
Worked example: a class of eight students scored 78, 85, 92, 85, 90, 76, 85, 94 on a test. What is the mean score?
Step 1 — Count the values. There are 8 scores, so n = 8.
Step 2 — Add up all the values. 78 + 85 + 92 + 85 + 90 + 76 + 85 + 94 = 685.
Step 3 — Divide the sum by the count. 685 ÷ 8 = 85.625. The mean test score is 85.625 — about 85.6.
Step 4 — Sanity-check the answer. The mean must sit between the smallest value (76) and the largest (94) — the minimum and maximum of the set — and 85.625 does. It should also sit near the middle of the pack: half the class scored 85 or below, half 85 or above, so an answer near 85 makes sense. If your mean ever lands outside the min–max range, the arithmetic went wrong somewhere. Our full guide to calculating the mean works through decimals, negatives, frequency tables and grouped data the same way.
Reading your result: what the mean, median and mode say together
Run any data set through the calculator and compare the three numbers — their relationship describes the shape of your data faster than any chart:
| Pattern | What it means |
|---|---|
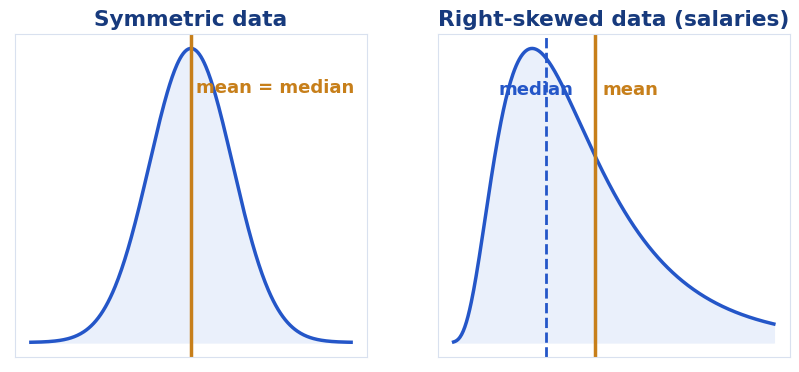
| Mean ≈ median | The data is roughly symmetric — no extreme values pulling either way. The mean is a fair summary. |
| Mean clearly above the median | A few large values are pulling the mean up (right-skewed data — incomes are the classic case). Report the median alongside. |
| Mean clearly below the median | A few small values are pulling the mean down (left-skewed data). Report the median alongside. |
| Mode far from both | The most common value is not the "middle" experience — common with grouped or clustered data (e.g. shoe sizes). |
Spread matters too. The quartiles split the sorted data into quarters: Q1 is the 25th-percentile value and Q3 the 75th, and the gap between them is the interquartile range (IQR). Values lying beyond the upper or lower fence — Q3 + 1.5 × IQR or Q1 − 1.5 × IQR — are flagged as outliers. The five number summary calculator computes all of that from the same paste.
Mean vs median vs mode — and the outlier problem
The three measures answer three different questions. The mean asks "if the total were shared equally, what would each get?" The median asks "what is the middle value when the data is sorted?" The mode asks "what shows up most often?" — build a tally of each data value and the most frequent one wins.
Here is why the difference matters. Six employees earn $32,000, $34,000, $35,000, $36,000, $38,000 — and the owner earns $240,000. The mean salary is $415,000 ÷ 6 = $69,166.67, a figure nobody at the company actually earns anything close to. The median is $35,500 — the average of the two middle values, $35,000 and $36,000 — which describes a typical salary honestly. The mode does not exist here at all: no salary repeats.
The rule of thumb: use the mean when the data is fairly even and every value counts (test scores, temperatures, measurements). Reach for the median when a few extreme values would drag the mean away from the typical case (incomes, house prices, waiting times). Use the mode when the question is about popularity or frequency (the best-selling size, the most common grade). Our dedicated mean vs median guide works through this in more depth — and the calculator above always shows all three, so you can compare before you quote a number.
The four types of mean
"Mean" usually means the arithmetic mean above — but there are four, and each has a job:
- Arithmetic mean — add and divide. The default for scores, heights, temperatures and most everyday data. (This page.)
- Weighted mean — some values count more than others, because each carries a weight. Course grades and GPA work this way. → Weighted Mean Calculator
- Geometric mean — multiplies the values and takes the nth root. The right average for growth rates and percentages that compound. → Geometric Mean Calculator
- Harmonic mean — the correct average for rates over equal distances or amounts, like average speed on a round trip. → Harmonic Mean Calculator
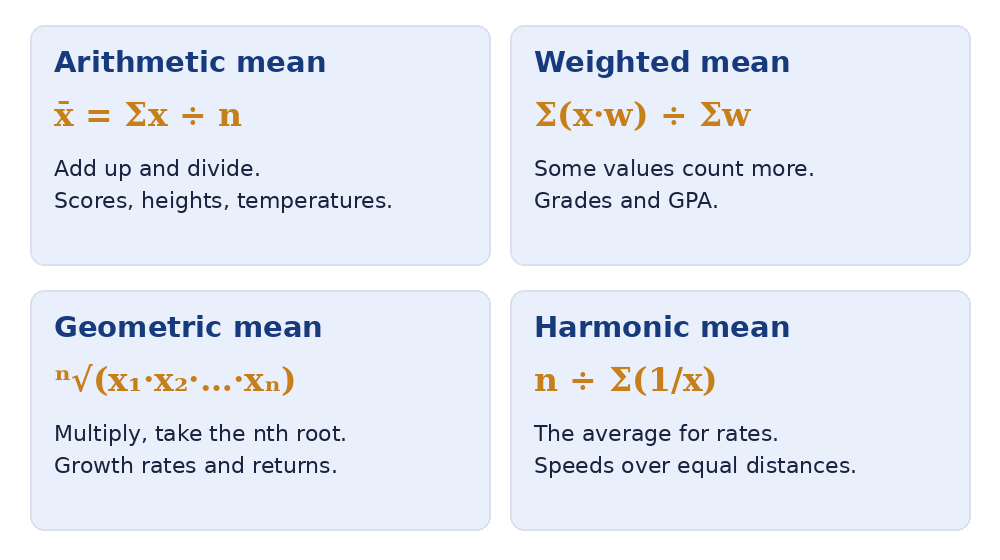
For any set of positive numbers the three pure means line up in a fixed order: harmonic ≤ geometric ≤ arithmetic. If your data grows or is a rate, the arithmetic mean alone will overstate the "typical" value — that is exactly when the other two earn their place.
Common mistakes to avoid
- Averaging averages. A class of 10 students averages 80 and a class of 30 averages 60. The combined average is NOT 70 — it is (800 + 1,800) ÷ 40 = 65, because the bigger class counts three times as much. Always go back to totals: sum everything, then divide by the total count.
- Counting blanks as zeros. Paste a column with an empty cell and a careless tool adds a phantom 0, dragging the mean down. This calculator ignores anything that is not a number — and the Count in the results panel tells you exactly how many values were used, so check it against how many you expected.
- Deleting outliers without saying so. Removing the $240,000 salary makes the mean look tidy — and dishonest. If you exclude a value, report that you did and why; better, quote the median next to the mean.
- Rounding too early. Round only the final answer. Rounding every value first, or rounding the sum, compounds into a visibly wrong mean on longer lists.
- Forcing the mean onto skewed data. When the mean and median disagree sharply, the mean is not "the answer" — it is one of two answers, and the median usually describes the typical case better.
The full list, with fixes, is in our guide to common mean calculation mistakes.
Where the mean is used
- Grades and test scores. Class averages, grade boundaries and "the average student scored…" all rest on the arithmetic mean — it is the first statistic most people ever meet.
- Sports. Batting averages, points per game, average lap times: season summaries are means over games, which is why one huge performance moves them.
- Money and business. Average order value, average salary, cost per customer — business reporting runs on means, with the median brought in when a few giant values distort the picture.
- Weather and climate. "Average temperature" for a month or a city is a mean of daily readings — and climate normals are means over 30 years of them.
- Science and research. Experimental results are reported as means with standard deviation, because the mean is the value that later statistics (including z-scores) are built on.
Frequently asked questions
What is the mean in math?
The mean is the average of a set of numbers: the sum of all the values divided by how many values there are. For 4, 8 and 15, the sum is 27 and the count is 3, so the mean is 27 ÷ 3 = 9. It is the most common of the three measures of central tendency, ahead of the median and the mode.
How do you calculate the mean?
In three steps: count the values, add them all up, and divide the total by the count. Example: for 78, 85, 92, 85, 90, 76, 85, 94 — the sum is 685, the count is 8, and 685 ÷ 8 = 85.625. The calculator at the top of this page does the same working instantly and shows every step.
Is the mean the same as the average?
In everyday use, yes — 'average' almost always means the arithmetic mean. In statistics, 'average' is the looser word: the median and mode are also averages in the broad sense (measures of central tendency), which is why textbooks say 'mean' when they want to be precise. If someone says 'average salary,' ask which one they mean — the answer changes the story.
What is the difference between the mean, median and mode?
The mean is the sum divided by the count — every value affects it. The median is the middle value of the sorted data — extreme values barely move it. The mode is the value that appears most often. For 1, 2, 2, 9: the mean is 3.5, the median is 2, and the mode is 2 — the single large value pulls only the mean upward.
Can the mean be a decimal, or a number that is not in the data set?
Yes to both, and it is completely normal. The test scores on this page average to 85.625 — a value nobody scored, with a decimal attached. The mean is a balance point, not a data point, so it only has to fall between the smallest and largest values; it never has to be one of the values themselves.
What if a data set has no mode, or more than one?
If every value appears exactly once, there is no mode — this calculator says 'No mode' rather than inventing one. If two values tie for most frequent, the set is bimodal and both are modes; several tied values make it multimodal. Example: in 1, 2, 2, 3, 4, 4, 5, both 2 and 4 appear twice, so the modes are 2 and 4.
What is the difference between the sample mean and the population mean?
The calculation is identical — sum divided by count. The difference is what the data represents and the symbol used: x̄ for a sample (some of the group), μ for a population (the whole group). Where it does matter is standard deviation, which divides by n − 1 for a sample. That is why the toggle on this calculator changes the standard deviation and variance, but never the mean.
How do I use data from Excel or Google Sheets?
Copy the cells — a column, a row, or a block — and paste them straight into the box. Tabs and line breaks from a spreadsheet paste are handled automatically, along with commas and spaces. Check the Count in the results panel against the number of values you copied; if they match, every value was read.
What does the calculator do with blanks, words or stray characters?
It ignores them. An empty cell, a label, or a typo is skipped rather than treated as zero, because a phantom zero would silently pull the mean down. The Count tells you how many real values were used — if it is lower than you expected, one of your entries was not a number.
Is this mean calculator free?
Yes — completely free, with no signup, no limits and no watermarks. The full results (mean, median, mode, range, sum, count, standard deviation, variance) and the step-by-step solution are all included, and your numbers are processed in your browser, never sent to a server.
Related calculators
Working with z-scores next?
Once you have a mean and a standard deviation, the natural next step is standardizing a value — our sister site's Z Score Calculator does exactly that, with the same show-your-working approach.