Mode Calculator
Find the value that appears most often in your data — with the full frequency table shown as the working.
Separate values with commas, spaces or line breaks — a column pasted from Excel or Google Sheets works as-is. Anything that is not a number is ignored, never counted as zero.
What is the mode?
The mode is the most frequent value in a data set — the value that appears more often than any other. It is the third measure of central tendency, next to the mean and the median, and it answers the most everyday of the three questions: "which one shows up most?" A shop deciding which shoe size to stock most heavily, or a teacher noting the most common grade, is using the mode whether they call it that or not.
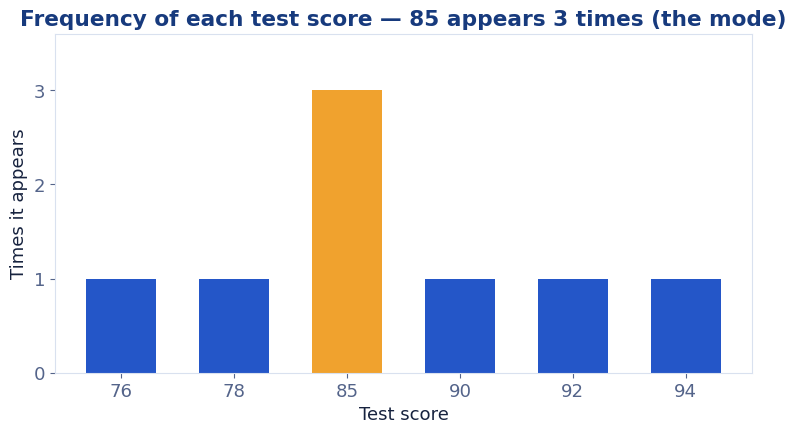
Finding it needs no formula — just an honest tally. That is why this calculator's working is a frequency table: every value, and exactly how many times it appears.
How to find the mode
Step 1 — Count how many times each value appears. Step 2 — Compare the counts. The value with the highest count is the mode.
Worked example: 4, 6, 6, 8, 6, 9, 8. The tally is 4 → 1, 6 → 3, 8 → 2, 9 → 1. The highest count is 3, belonging to 6 — so the mode is 6. Our mode guide shows the same counting method on longer lists, with tally charts.
What if there are two modes (bimodal)?
Two values can tie for the highest count. The set 1, 2, 2, 3, 4, 4, 5 has 2 appearing twice and 4 appearing twice, with everything else once — so it has two modes, 2 and 4, and is called bimodal. Three or more tied values make a set multimodal. A bimodal result is often a clue that the data really holds two different groups — two classes marked by different teachers, or customers of two different ages — and splitting the data may tell a better story than any single average.
What if there is no mode?
If every value appears exactly once, no value is "most frequent" and the set simply has no mode. This calculator says "No mode" rather than picking a value at random — a small honesty that matters in homework and reports alike. As data sets grow, a mode usually emerges; in small sets, no mode is a perfectly respectable answer.
When the mode is the right average
Use the mode when the question is about popularity or frequency: the best-selling size, the most common score, the most likely outcome. It is also the only average that survives categorical data (next section). Its weakness is the opposite of the mean's: it ignores most of the data. In 1, 2, 2, 9 the mode is 2 — the 9, which the mean feels keenly (mean 3.5), might as well not exist. The mean median mode calculator shows all three together so you can judge which tells the truth about your set.
Mode for categories (non-numeric data)
The mode is the only measure of central tendency that works when the "values" are not numbers at all. A tortilla-chip maker counting which flavour sells most, a school counting which packed-lunch item appears most, a transit agency counting boardings by route — each is finding a mode. There is no mean of "cheese, salted, cheese, spicy" and no median either, but the mode — cheese — is immediate. Counting is the whole method; this calculator does it for numbers, and the same tally works for anything you can count.
Frequently asked questions
How do you calculate the mode?
Count how often each value appears; the most frequent value is the mode. In 4, 6, 6, 8, 6, 9, 8 the value 6 appears three times, so the mode is 6.
Can a data set have two modes?
Yes — that is called bimodal. 1, 2, 2, 3, 4, 4, 5 has two modes, 2 and 4, because both appear twice.
What if no value repeats?
Then the set has no mode. This calculator says so plainly instead of guessing.
What does multimodal mean?
A set with three or more values tied for most frequent is called multimodal. The calculator lists every tied value and labels the set for you.
Can the mode be used for words or categories?
Yes — the mode is the only one of the three averages that works on non-numeric data. The most common shoe size, the best-selling colour and the most frequent bus route are all modes. This calculator handles numbers; the counting idea is identical for categories.