Variance Calculator
Paste your numbers to get sample (s²) and population (σ²) variance — with the squared-deviation table as the working.
Separate values with commas, spaces or line breaks — a column pasted from Excel or Google Sheets works as-is. Anything that is not a number is ignored, never counted as zero.
The toggle changes only the standard deviation and variance — the mean, median and mode are the same either way.
What is variance?
Variance is the average of the squared differences from the mean — the engine room of spread statistics. Squaring the deviations does two jobs at once: it makes every deviation positive (so above-average and below-average values cannot cancel out), and it penalizes large deviations far more than small ones, so a data set with a few wild values earns a much bigger variance than a tidy one. The variance is rarely the final number people quote — its square root, the standard deviation, takes that role — but every standard deviation you have ever seen was a variance one step earlier.
Variance formula (sample and population)
Population: σ² = Σ(x − μ)² ÷ N
The only difference between the two formulas is the divisor: n − 1 when your data is a sample, N when it is the whole population.
How to calculate variance
Worked example — the same test scores used across this site, 78, 85, 92, 85, 90, 76, 85, 94 (mean 85.625):
Step 1 — Mean: 685 ÷ 8 = 85.625. Step 2 — Subtract and square: each score minus 85.625, squared — the deviation table above lists them for your data. Step 3 — Add: the squared deviations sum to 281.875. Step 4 — Divide: by 7 for a sample → s² ≈ 40.27; by 8 for a population → σ² ≈ 35.23.
Variance vs standard deviation
| Variance | Standard deviation | |
|---|---|---|
| Definition | Average squared deviation | Square root of the variance |
| Units | Squared (points², $²) | Original (points, $) |
| Used for | Further maths: ANOVA, regression, combining spreads | Reporting and interpreting spread |
| Example (sample) | 40.27 | 6.35 |
Need the square-rooted version as the headline? The standard deviation calculator runs the identical engine with the SD on top.
Why variance uses squared units
Squaring is not an arbitrary ritual. If you averaged the raw deviations, positives and negatives would cancel to exactly zero for any data set — a useless statistic. Squaring fixes the sign problem (absolute values would too — that is the mean absolute deviation, a gentler cousin) and, unlike absolute values, squares play nicely with the algebra behind regression, ANOVA and probability theory. The price is the squared unit, which is why variance lives inside calculations while the standard deviation does the talking.
A second worked example (small numbers)
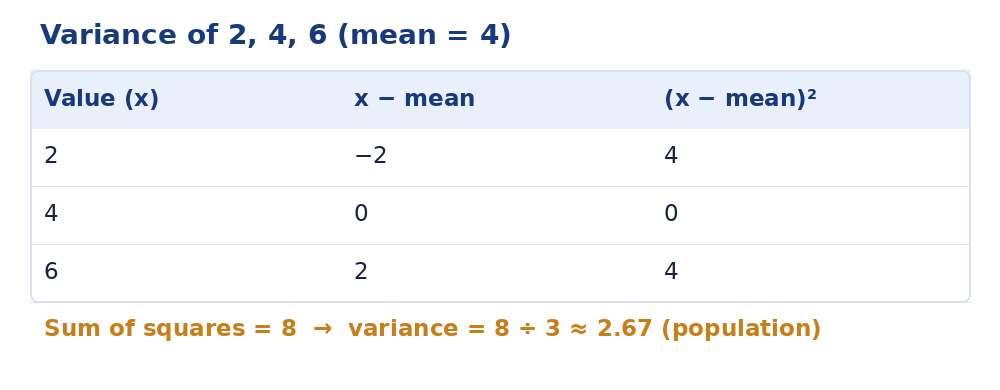
The set 2, 4, 6 keeps the arithmetic transparent. The mean is 4. The deviations are −2, 0 and 2; squared, they are 4, 0 and 4; their sum is 8. As a population, the variance is 8 ÷ 3 ≈ 2.67 (and the standard deviation is √2.67 ≈ 1.63). As a sample, the variance is 8 ÷ 2 = 4 (standard deviation exactly 2). One data set, two variances — the divisor is the only difference, and choosing it is a statement about what your data represents: everything there is, or a sample of something bigger. The diagram above shows this same example as a deviation table. Try it in the calculator: paste 2, 4, 6 and flip the toggle to watch 2.67 become 4.
Frequently asked questions
How do you calculate variance?
Find the mean, subtract it from each value, square each difference, then average the squares — dividing by n − 1 for a sample or N for a population.
Variance or standard deviation — which should I report?
Usually standard deviation, because it is in the original units. Variance is the step you calculate on the way there.
What is the variance of 78, 85, 92, 85, 90, 76, 85, 94?
The squared deviations sum to 281.875. Sample variance = 281.875 ÷ 7 ≈ 40.27; population variance = 281.875 ÷ 8 ≈ 35.23.
Can variance be negative?
No. Every squared deviation is zero or positive, so the variance is zero (all values identical) or positive — never negative.
What are the units of variance?
Squared units — if the data is in dollars, the variance is in dollars². That awkwardness is exactly why the standard deviation (its square root) is the reported figure.