How to Find the Mode
Frequency counting step by step — plus bimodal and multimodal sets, the 'no mode' case, and modes for categories like shoe sizes.
What the mode is
The mode is the most frequent value in a data set — the one that appears more often than any other. No formula, no sorting gymnastics: just honest counting. The mode calculator builds the frequency table for you; this guide is the by-hand method, including the three tricky outcomes — ties, several modes, and no mode at all.
Counting with a frequency table
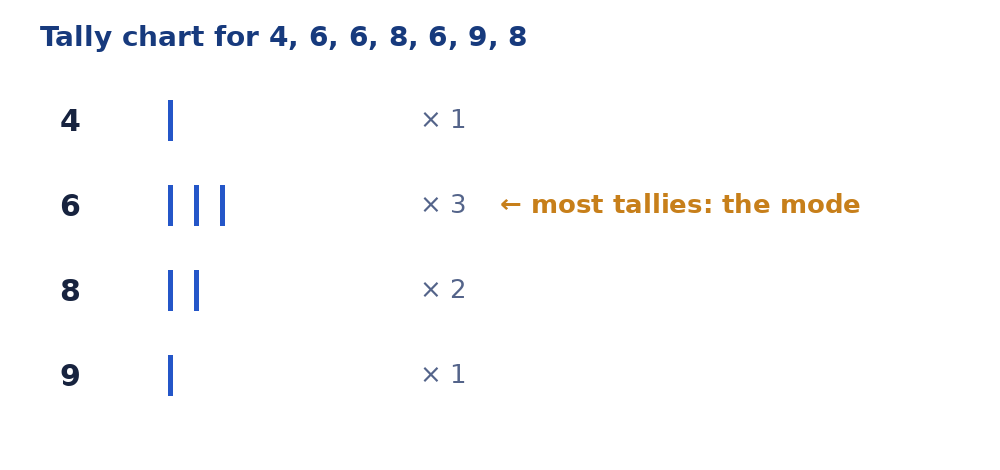
Step 1 — Go through the data once, tallying each value as you meet it. Step 2 — Read off the highest tally.
Example: 4, 6, 6, 8, 6, 9, 8. The tallies: 4 → 1, 6 → 3, 8 → 2, 9 → 1. The highest tally is 3, so the mode is 6. A frequency table (value → count) is the tidy written form of the tally, and it is the working this site's calculator shows for every set you paste.
Bimodal and multimodal sets
Two values can share the highest tally: in 1, 2, 2, 3, 4, 4, 5, both 2 and 4 appear twice, so the set is bimodal with modes 2 and 4. Three or more tied values make it multimodal. A bimodal result often hints the data contains two groups — two classes, two customer types — and is worth a sentence in any write-up rather than a silent average over the top of it.
No mode
If every value appears exactly once — 3, 7, 9, 14, 20 — there is no most-frequent value and the correct answer is no mode. Small sets often have no mode; larger real-world sets usually develop one. Report "no mode" plainly: inventing one, or substituting the mean, misstates the data.
Mode for categories
The mode is the only one of the three averages defined for non-numeric data. A shoe shop's most-stocked size, the most common packed-lunch item in a class survey, the busiest route on a transit network — all modes, found by the same tally. There is no mean of "red, blue, blue, green" and no median either, but the mode — blue — is immediate. When a question asks what is "most common" or "most popular", it is asking for the mode whatever words it uses. For the three measures together, see mean, median and mode compared.
The mode in the wild
Real modes rarely look like textbook lists. A shoe retailer reviewing a month of sales finds sizes 7, 8, 8, 9, 8, 10, 9, 8 — the mode, size 8, is the size to stock deepest, and no other average can answer that question. A teacher scanning a grade distribution sees B as the mode and learns more about the class than the mean alone would say. Transit planners count boardings by route and hour; the modal route at the modal hour gets the extra bus. In each case the data could be enormous and messy, but the method is the same tally you have just done by hand — count everything once, crown the most frequent. The one caution: a mode built on a handful of observations is fragile. Two more size-10 sales would not dethrone size 8 here, but in a five-sale week, treat any mode as a hint, not a verdict.
More guides
Frequently asked questions
How do you find the mode?
Count how often each value appears; the most frequent value is the mode. In 4, 6, 6, 8, 6, 9, 8 the value 6 appears three times, so the mode is 6.
What does bimodal mean?
A data set with two modes — two values tied for the highest count, like 2 and 4 in 1, 2, 2, 3, 4, 4, 5.
What if every value appears once?
The set has no mode. That is a valid answer — do not force one, and do not report '0' or the mean in its place.
Can the mode be a word?
Yes. The mode is the only average that works on categories: the most common shoe size, flavour or bus route is a mode, found by exactly the same counting.