Mean from a Frequency Table
Multiply, add, divide — the Σf·x ÷ Σf method worked in full, with grouped-data midpoints and the traps that catch everyone once.
Multiply, add, divide
Build two totals from the table — the sum of value × frequency, and the sum of the frequencies — then divide.
A frequency table compresses data: instead of listing 10, 10, 20, 20, 20, 30, 30, 30, 30, 30, it lists each value once with a count. The mean of the full list is still "sum ÷ count" — the table just lets you rebuild the sum efficiently, because value × frequency is that value's contribution to the total. The mean calculator with frequency runs this method on your table; here it is by hand.
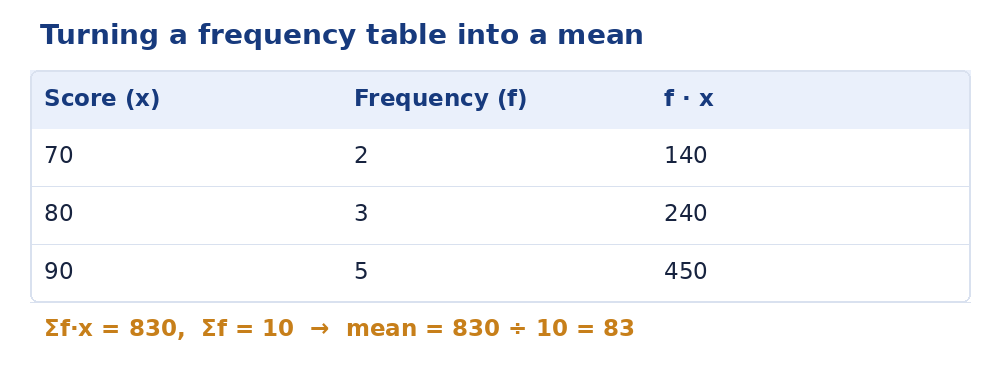
A worked example
Test scores summarized as a table — score 10 earned by 2 students, 20 by 3 students, 30 by 5 students:
| Value (x) | Frequency (f) | f·x |
|---|---|---|
| 10 | 2 | 20 |
| 20 | 3 | 60 |
| 30 | 5 | 150 |
| Totals | Σf = 10 | Σf·x = 230 |
Mean = 230 ÷ 10 = 23. Sanity checks: 23 lies between the smallest (10) and largest (30) values ✓, and it sits closer to 30 than to 10 because the biggest group of students earned 30 ✓. Verify against the raw list if you doubt it — 10, 10, 20, 20, 20, 30, 30, 30, 30, 30 sums to 230 over 10 values: same answer, because it is the same calculation wearing a table.
Grouped-data notes
Grouped tables replace values with class ranges (0–10, 10–20, 20–30). Each class contributes its midpoint — (0 + 10) ÷ 2 = 5, then 15, 25 — as its x. With frequencies 3, 5, 2: Σf·x = 15 + 75 + 50 = 140, Σf = 10, estimated mean = 14. It is an estimate because every value in the 10–20 class is treated as exactly 15; the true values were discarded when the data was grouped. Narrower classes make the estimate tighter. The frequency calculator's Grouped tab fills midpoints in automatically.
The common traps to avoid
- Dividing by the number of rows. The divisor is Σf (total count of values), not the count of distinct values. Three rows ≠ three data points.
- Forgetting a row's f·x. Every row contributes, including frequency-1 rows.
- Treating grouped results as exact. Report grouped means as estimates, and say so.
- Mixing the table with raw values. If some data is in the table and some is a list, convert the list into the table first, then run one calculation.
For the underlying method on plain lists, see how to calculate the mean.
More guides
Frequently asked questions
How do you calculate the mean from a frequency table?
For each row, multiply the value by its frequency (f·x). Add all the f·x products (Σf·x), add all the frequencies (Σf), and divide: mean = Σf·x ÷ Σf.
What is the mean of the table 10×2, 20×3, 30×5?
Σf·x = 20 + 60 + 150 = 230 and Σf = 10, so the mean is 230 ÷ 10 = 23.
How do grouped frequency tables differ?
The values are ranges (classes), so each class is represented by its midpoint. The result is an estimate of the mean, because the exact values inside each class are unknown.
What is the most common frequency-table mistake?
Dividing by the number of rows instead of the total frequency. Three rows with frequencies 2, 3, 5 describe ten values, not three — the divisor is Σf = 10.